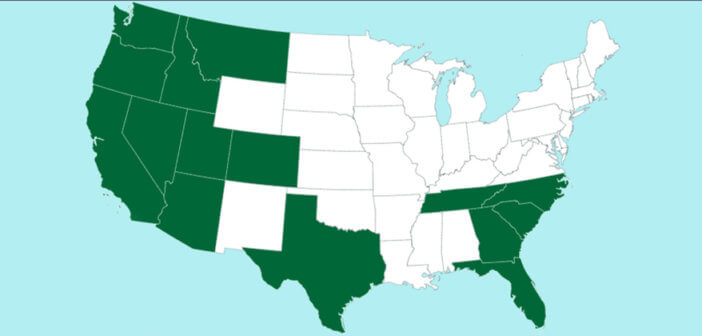
Population growth is only one factor in whether churches grow, but it is a key factor. At the end of December, the U.S. Census Bureau released the projected population changes in the United States for the period beginning July 1, 2016, and ending July 1, 2017. The charts below indicate the states (and District of Columbia) that showed the largest numeric and percentage growth during this most recent one-year period for which we have figures. Six states (noted with an asterisk) appear on both lists. Shown in these charts are states with numeric growth of 100,000 or more and states with percentage growth of one percent or more.
| States Growing 100,000 or More 2016-17 | ||
| Rank | Name | Numeric growth |
| 1 | Texas* | 399,734 |
| 2 | Florida* | 327,811 |
| 3 | California | 240,177 |
| 4 | Washington* | 124,809 |
| 5 | North Carolina* | 116,730 |
| 6 | Georgia* | 115,759 |
| 7 | Arizona* | 107,628 |
| * = state appears on both lists | ||
| States Growing 1 Percent or More 2016-17 | ||
| Rank | Name | Percent growth |
| 1 | Idaho | 2.2 |
| 2 | Nevada | 2.0 |
| 3 | Utah | 1.9 |
| 4 | Washington* | 1.7 |
| 5 | Florida* | 1.6 |
| 6 | Arizona* | 1.6 |
| 7 | Texas* | 1.4 |
| 8 | District of Columbia | 1.4 |
| 9 | Colorado | 1.4 |
| 10 | Oregon | 1.4 |
| 11 | South Carolina | 1.3 |
| 12 | North Carolina* | 1.1 |
| 13 | Montana | 1.1 |
| 14 | Georgia* | 1.1 |
| 15 | Tennessee | 1.0 |
| * = state appears on both lists | ||


