

![]()
 Download the 2024 Clergy Age Trends Report.
Highlights of the 2024 Report
Impact of Disaffiliation on Numbers and Ages of United Methodist Clergy
Any report on changes in clergy numbers and ages must acknowledge clergy leaving as a result of the disaffiliation process between 2019 and 2024. While this is a factor in declining clergy numbers, it is difficult with the information we have at this point to identify the specific impact of disaffiliation on various age groupings of clergy. There are several variables that cause numbers of clergy by age to change year by year. There are new people entering the age group, others who age out of the cohort, as well as those who withdraw or die. However, there are some things we know from our age statistics and our previous study of disaffiliations overall, Twenty-Five Percent of Churches Disaffiliated from the United Methodist Church. These are trends that appear to be present, but more data are needed for certainty.
- Clergy losses were greatest among local pastors and least among deacons.
- Among elders, it appears that losses occurred more among older (55-72) elders and young elders (under 35).
Young Elder Numbers Continue Decline But Increase as Proportion of All Elders
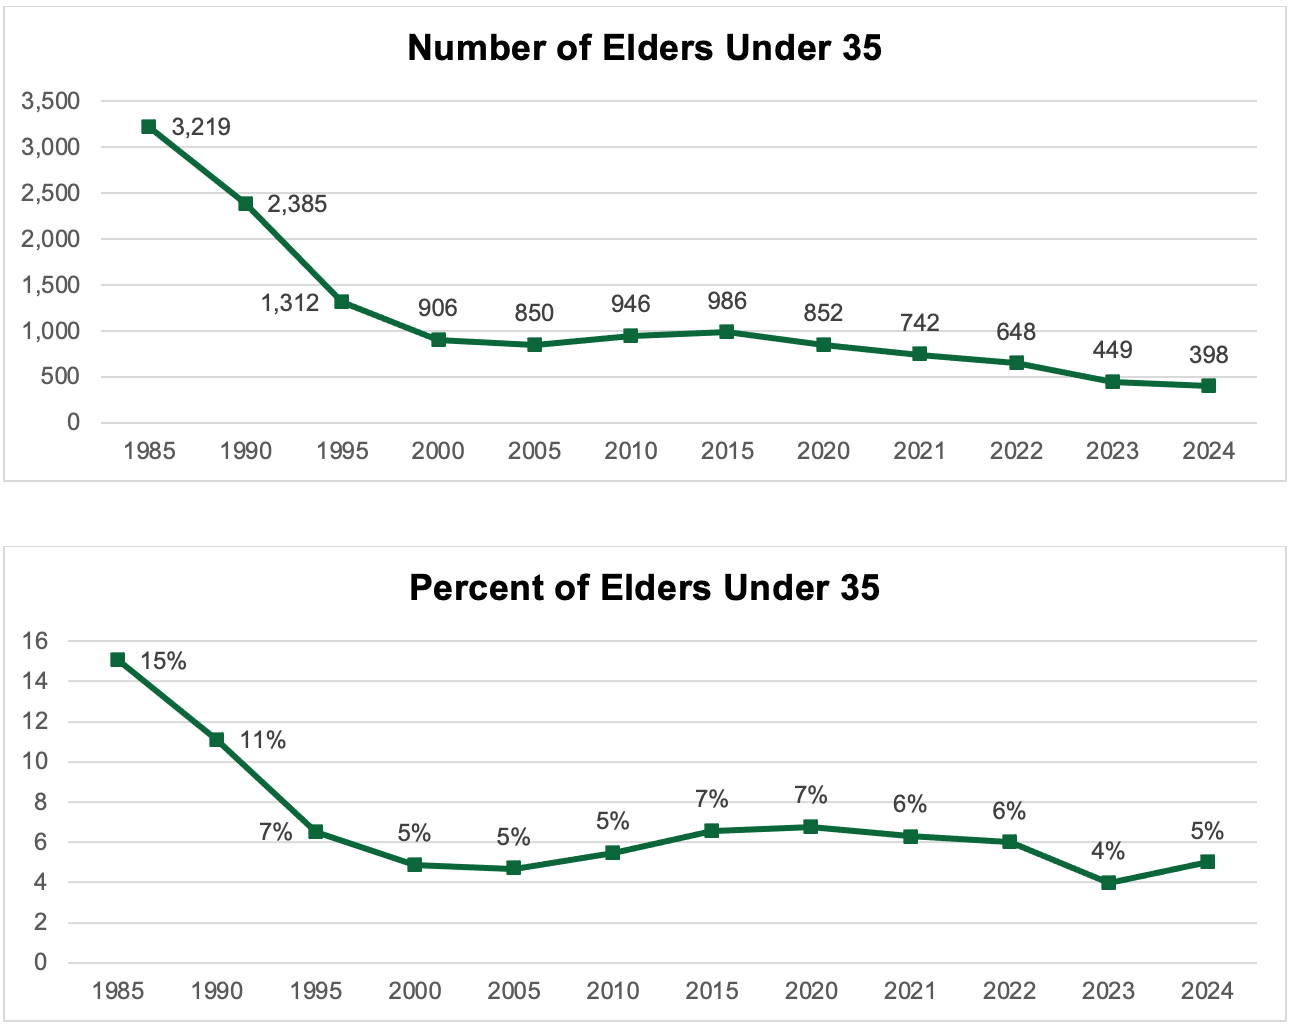 The recent decline in the number of young elders (under 35) began in 2017 and followed modest gains after the low point of 2005. That decline continues; however, the scale of the decline increased dramatically beginning in 2019. Since the most recent decline began in 2019, there has been a decline of 63 percent in the number of under-35 elders. The losses have been greater among men than women based on the proportion of each among young elders. The number of young elders in 2024 is 398, a loss of 51 in the past year. This year sets a new record for the fewest young elders.
However, since the overall number of active elders of all ages continues to decline, young elders constitute 5 percent of active elders in 2024, up from 4 percent in 2023.
Some Increased Presence of Middle Age Elders
Beginning in 2000, we saw a trend of fewer elders in the middle age (35-54) group and more elders in the older (55-72) group. Despite a mandatory retirement age of 72, with most retiring before that age, the pool of older elders continued to grow for twenty years. In 2020, a modest turn in this trend began that continues in 2024. The middle age group as a proportion of all elders increased to 45 percent in 2024 from 44 percent in 2023. The 55-72 elder age group decreased to 50 percent in 2024 from 52 percent in 2023.
Young Deacons and Local Pastors Also Decrease
There were also decreases in the number of young deacons and young local pastors in 2024. In 2024, there were 60 deacons younger than 35 or 7 percent of all deacons, down from 74 young deacons comprising 8 percent of all deacons in 2023. In 2024, there were 294 local pastors younger than 35 down from 416 young local pastors in 2023, comprising 7 percent of all local pastors in both years. Keep in mind that the number of deacons in this report is lower than their presence in the denomination since many deacons serving in settings other than congregations have pension plans through those agencies rather than Wespath, from which our numbers come.
![]()
 Download the 2024 Clergy Age Trends Report.
Previous Clergy Age Trends Reports
![]() 2023 | 2022 | 2021 | 2020 | 2019 | 2018 | 2017 | 2016 | 2015 | 2014 | 2013 | 2012 | 2011 | 2010 | 2009 | 2008 | 2007 | 2006
2023 | 2022 | 2021 | 2020 | 2019 | 2018 | 2017 | 2016 | 2015 | 2014 | 2013 | 2012 | 2011 | 2010 | 2009 | 2008 | 2007 | 2006


