![]()
 Download the 2020 Clergy Age Trends Report.
Highlights of the 2020 Report
Decline in the Number of Young Elders Continues
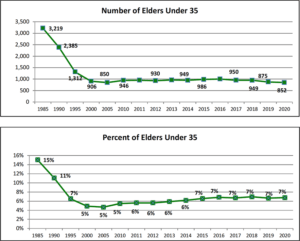
Since reaching the record low point for under 35 elders in 2005, there have been these phases:
2006–2016 (Growth)
The number of young elders grew gradually but steadily through this period. While the number of male young elders decreased, their number of young female elders provided all the gains.
2016–2018 (Modest Decline)
The number of young elders declined modestly. There actually was a net gain of men by 3 with dramatic declines in women (-51).
2018–2020 (Major Decline)
Even in the period of growth, there were ups and downs between one year and next. However, what occurred since 2018 is of a different order. Not only was there a decline of 97 young elders, the decline was closer to proportional than in the past. There was a net loss of 68 men and 29 women. Men represented 70 percent while representing 62 percent of the young elder pool with women representing 30 percent of the losses while representing 38 percent of young elders overall.
In 2020, the number of young elders came within two of reaching the previous low of 850 in 2005.
Interestingly, due to the overall decline in the total number of active elders in the United Methodist Church, the percentage of young elders of all active elders remains around 7 percent, up from the record low of 5 percent in 2005.
Middle Age and Older Elders Show First Signs of Younger Trend
Since 2000 we have been watching a trend of having fewer elders in the middle age (35-54) group and more elders in the older (55-72) group. Since those in the older group face a mandatory retirement age of 72 with most elders retiring well before that age, it seemed that this expanding pool of older elders could not continue to grow indefinitely. After twenty years of growth, one began to wonder that such a decline might never happen. This year we see a modest turn in this trend with a one percent shift from the older group to the middle age group. It will be interesting to see if the trend continues. Though the change is small, it could mark a shift we have not seen in twenty years in the age makeup trend of United Methodist elders.
Local Pastors Continue to Grow in Proportion to Elders
Elders and local pastors are appointed as pastors of congregations. In 1990, there were over five elders for each local pastor; today there are 1.7 elders for each local pastor. In 2020, there are 12,610 elders and 7,478 local pastors. The result is that since 1990 there are 8,352 fewer elders and 3,627 more local pastors. As elders have declined in numbers by 41 percent since 1990, local pastors have increased in numbers by 90 percent.
![]()
 Download the 2020 Clergy Age Trends Report.
Previous Clergy Age Trends Reports
![]() 2019 | 2018 | 2017 | 2016 | 2015 | 2014 | 2013 | 2012 | 2011 | 2010 | 2009 | 2008 | 2007 | 2006
2019 | 2018 | 2017 | 2016 | 2015 | 2014 | 2013 | 2012 | 2011 | 2010 | 2009 | 2008 | 2007 | 2006

