The Lewis Center has issued a final report on disaffiliating churches in the United Methodist Church covering 7,631 churches approved by annual conferences for disaffiliation by December 31, 2023. There continue to be more similarities than differences between the cohort of disaffiliating churches and the total pool of United Methodist churches. Disaffiliating churches are disproportionately in the Southeastern (50 percent) and South Central (21 percent) jurisdictions. Conferences with 30 percent or more churches disaffiliating are highlighted here.
Twenty-Five Percent of Churches Disaffiliated
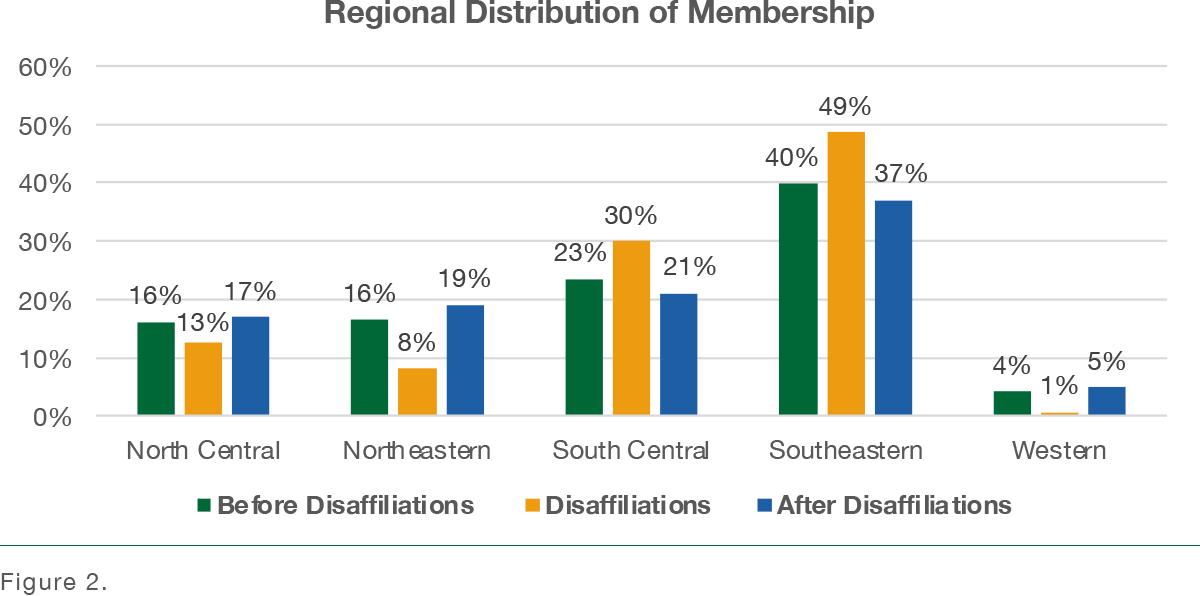
The 25 percent of churches disaffiliating between 2019 and 2023 represented 24 percent of the denomination’s membership in the United States.
No one knew what to expect when disaffiliations began, certainly not how many churches would leave. For those expecting limited disaffiliations, the percentage of under 10 percent would have represented the comparable losses of churches and members in other similar denominations experiencing division in recent years such as the Evangelical Lutheran Church in America and the Presbyterian Church (U.S.A.). On the other hand, the 1844 division of Methodism over slavery, the break that served as a model for many proposing this denominational split, resulted in a 40 percent membership loss to the Methodist Episcopal Church when the Methodist Episcopal Church, South, was formed.
The Southeastern Jurisdiction Accounted for 50 Percent of Disaffiliations
From the earliest disaffiliations, churches in the Southeastern Jurisdiction showed the most interest in disaffiliating. In 2019, 35 percent of United Methodist churches in the United States were in the Southeastern Jurisdiction. However, 50 percent of disaffiliating churches were in that jurisdiction. The other jurisdiction with disproportionately more disaffiliations is the South Central Jurisdiction. In 2019, 17 percent of churches were in the South Central Jurisdiction, whereas 21 percent of disaffiliations were in that jurisdiction. Another significant block of conferences with higher than average rates of disaffiliations includes Ohio, Indiana, and Pennsylvania.
Figure 1 shows the percentage of churches in each district before disaffiliations began, the percentage of disaffiliating churches from each jurisdiction, and the percentage of churches remaining from each jurisdiction.
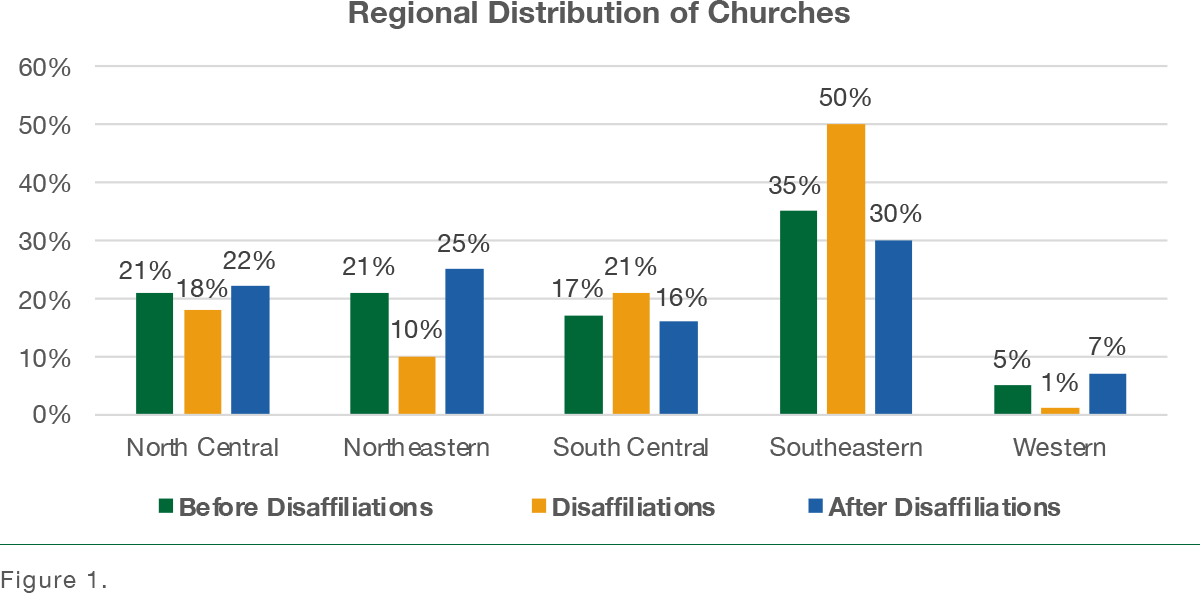 Figure 2 shows the percentage of members in each jurisdiction before disaffiliations began, the percentage of members from disaffiliating churches in each jurisdiction, and the percentage of members in churches remaining from each jurisdiction. These figures are not exact because memberships often changed based on the disaffiliation decisions, with some transferring or changing their church membership in response to the action taken by churches.
 Churches Seceding and Staying Were the Same Size
From the beginning of the disaffiliation process, the sizes of churches disaffiliating and those remaining have been similar. The median worship attendance for disaffiliating churches was 38, the same as the median attendance of all United Methodist churches.
Furthermore, disaffiliating churches and all United Methodist churches tend to match in the sizes of congregations based on worship attendance cohorts (table 1). The percentages are not exactly the same in every size group but always very close to each other.
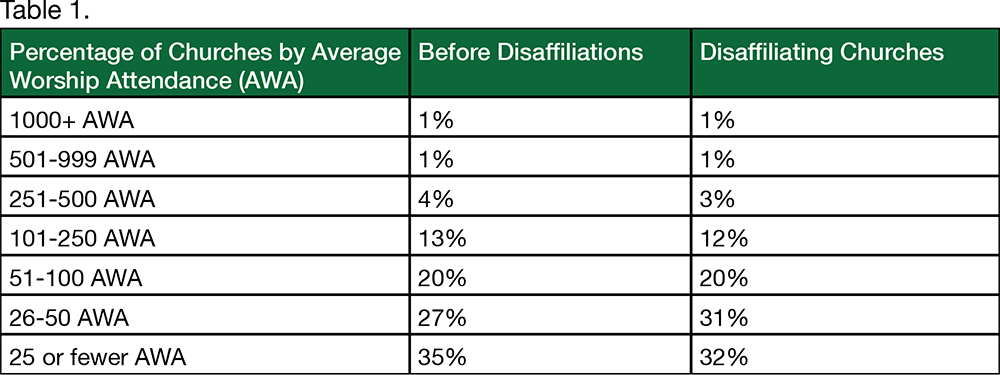
Notice the predominance of smaller churches in both groups. Churches with 50 or fewer in worship attendance constitute 62 percent before disaffiliation and 63 percent of disaffiliating churches. In fact, the current attendance of these churches is probably lower than these figures from 2019. Attendance numbers reported in subsequent years have been much smaller for virtually all congregations. Chances are that the median attendance today is well below the 38 each group reported in 2019.
Disaffiliating Churches Are Disproportionately White
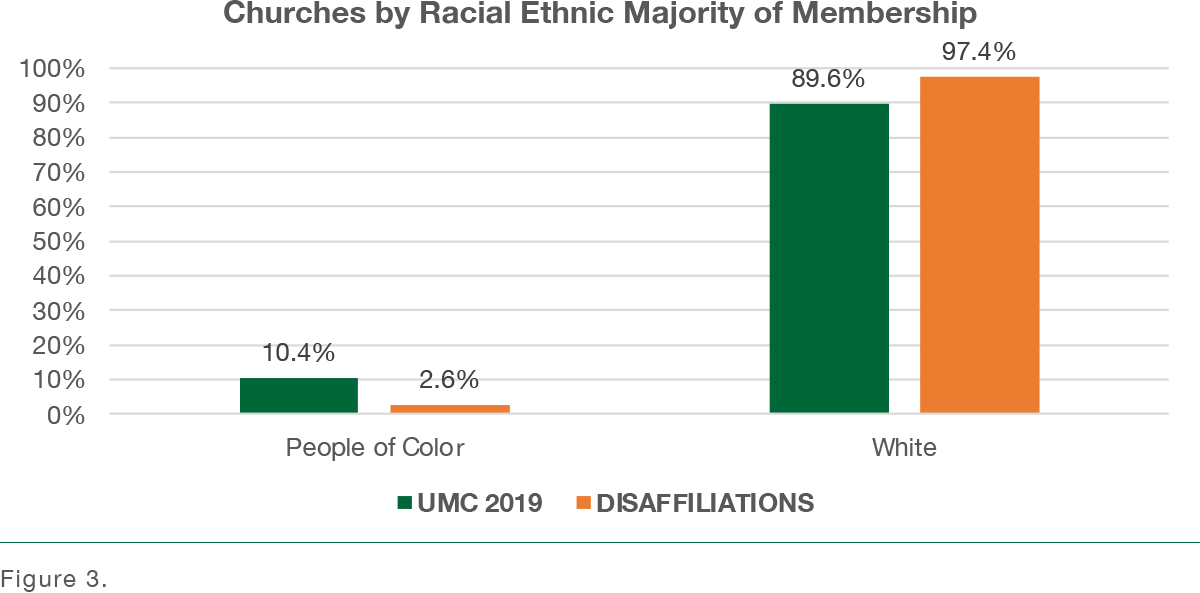
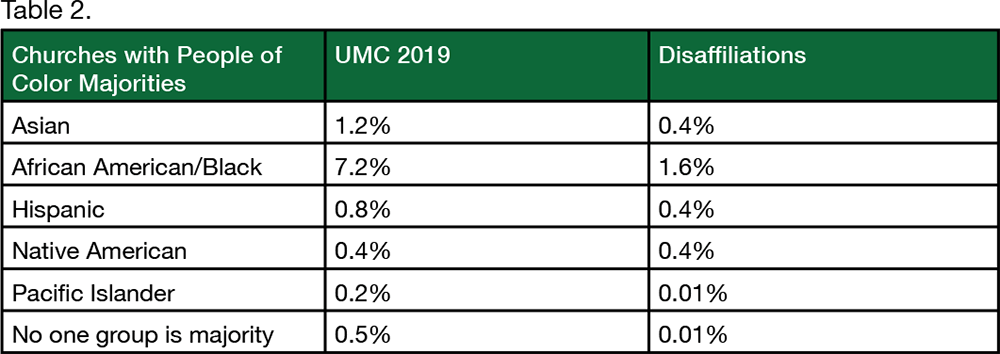
Disaffiliation had far greater appeal for churches with majority white memberships (figure 3). There were churches comprised of people of color that disaffiliated including some, it was reported, with much enthusiasm. However, in the end, relatively few did so (table 2).
Disaffiliating Churches Were Less Likely to Have an Elder as Pastor
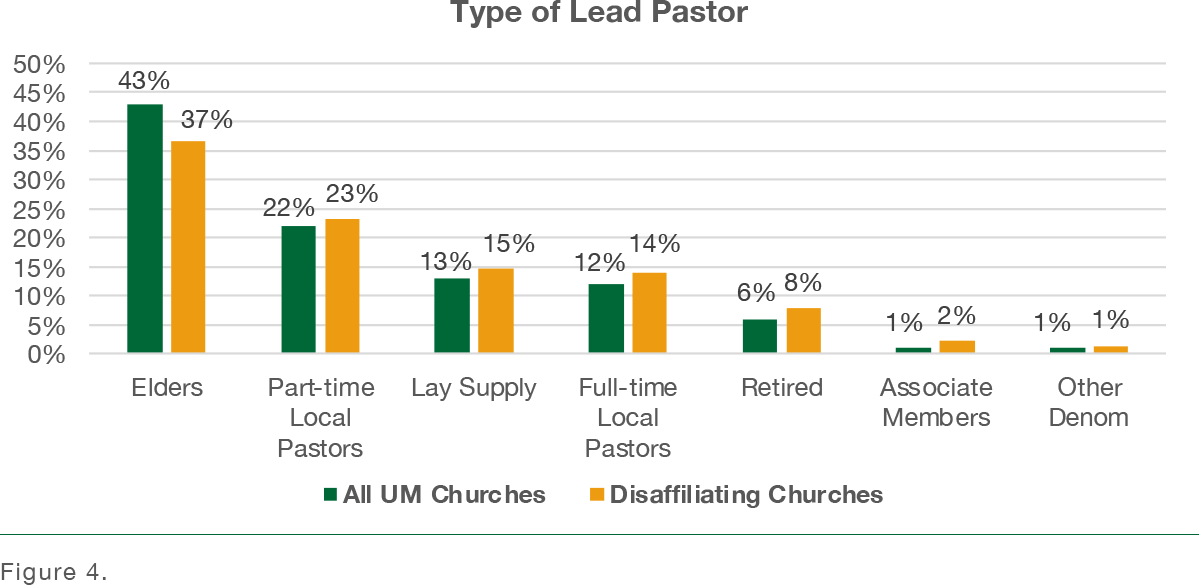
Compared to all United Methodist churches, disaffiliating churches have pastors who are less likely to be an active elder. Only 37 percent of disaffiliating churches were served by an active elder compared to 43 percent for all United Methodist churches. The difference for disaffiliating churches is made up by local pastors and lay supply pastors (figure 4).
Disaffiliating Churches Were More Likely to Have a Male Pastor
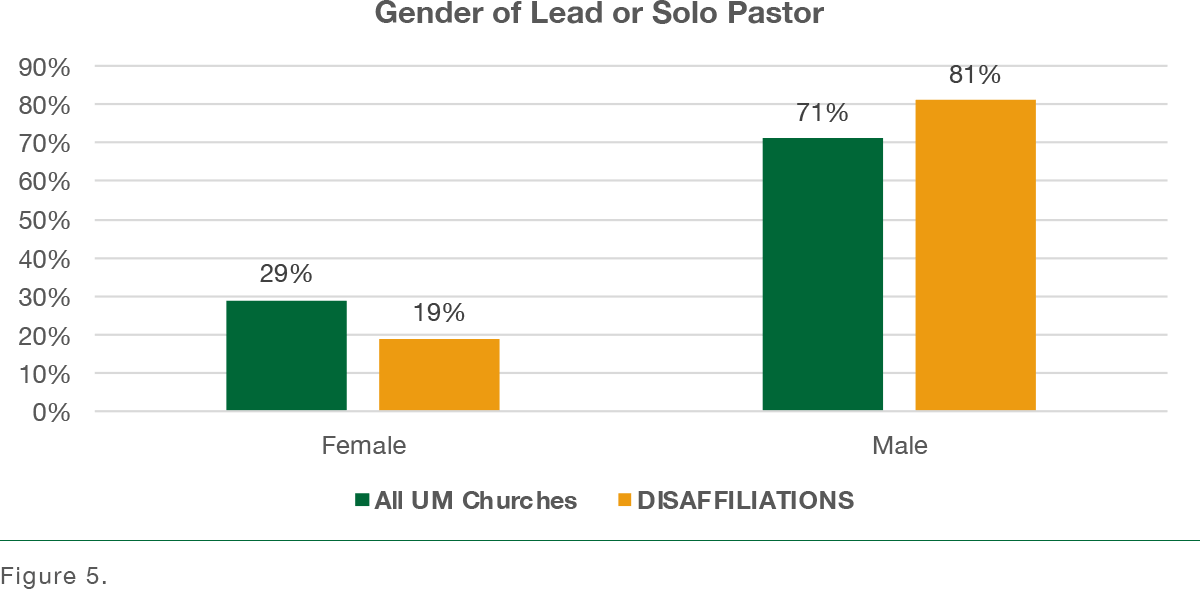
Only 19 percent of disaffiliating churches had a woman as lead pastor at the time of disaffiliation compared to 29 percent of United Methodist congregations as a whole who had a clergywoman as lead pastor (figure 5). This does not represent the proportion of pastors who are disaffiliating or remaining themselves. The pastor’s decision to remain a United Methodist pastor or to disaffiliate is a separate decision made by the pastors.
In previous reports, we have identified a range of similarities and differences between churches staying and leaving. Each time we noted that the similarities far outnumbered the differences. One reason is that those things that differentiate churches are often a function of their size. For example, a church with 25 worshipers will be more similar to a church of the same size a thousand miles away than to a neighboring church that is much larger.
Annual Conferences Most Impacted by Disaffiliations
Most United Methodist annual conferences are currently adjusting their operations based on changes due to disaffiliations. The financial impact at the conference level is not part of this report’s analysis, but it can be expected to vary with the percentage and size of congregations lost. Obviously, the impact is not felt equally across conferences. Some face minimal impact while others must make major realignments. Below is one way of looking at the degree of impact of disaffiliations on conferences considering only scope and location of disaffiliations (table 3). This list includes conferences with 30 percent or more churches disaffiliating. Keep in mind that overall 25 percent of churches disaffiliated.
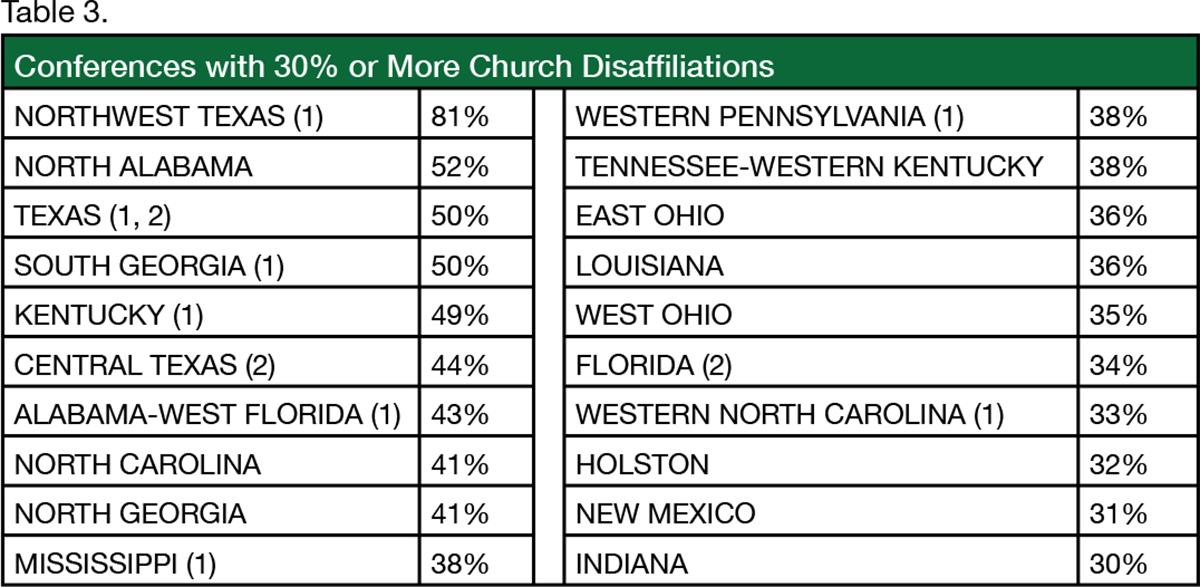
(1) = Median worship attendance of disaffiliating churches is 5 percent or higher than the overall conference median worship attendance.
(2) = Twenty percent or more of disaffiliating churches are located in highly populated counties in which two-thirds of the U.S. population resides.
 Related Resources
- Disaffiliating United Methodist Churches, 2019-2023: Final Report by Lovett H. Weems Jr.
- Disaffiliating Churches through June 2023 by Lovett H. Weems Jr.
- Disaffiliating Churches through 2022 by Lovett H. Weems Jr.
If you would like to share this article in your newsletter or other publication, please review our reprint guidelines.


