How does your church spending on personnel compare to other churches? Lovett Weems reports averages of the percentage of total expenditures that congregations spend on all personnel.
Church leaders often ask if their spending on personnel is reasonable in relation to comparable churches. This question is not easy to answer. We look first at some elements of church budgeting and the place of personnel. Churches spend their funds for a variety of purposes to fulfill their missions, and the four most common are personnel, facilities, missions, and programs. The personnel category includes all salary and benefits for all personnel, no matter their clergy or lay status or whether they serve in direct ministry roles or in support roles. Housing that is provided or housing allowances are included. Personnel expenses make up the largest percentage of almost all congregational expenditures. However, the workforce makeup varies considerably among congregations. Some have multiple full-time ordained and lay staff while others have a pastor, often part-time, and little other paid personnel.
Although the appropriate funding for a particular congregation may be difficult to assess, some information may help frame such conversations. This article reports averages of the percentage of total expenditures that congregations spend on all personnel. Keep in mind that averages are just that. Averages often include a broad range of figures. Do not expect your personnel expenditures to match precisely any of the percentages reported.
Comparisons by religious traditions
Two recent national surveys help us understand how spending on personnel varies as a proportion of all expenditures across some broad Christian traditions. Faith Communities Today (FACT) is a series of ongoing research surveys and practical reports about congregational life, conducted and published by the Cooperative Congregational Studies Partnership, a multi-faith group of religious researchers and faith leaders working in conjunction with Hartford Institute for Religion Research. Their latest research, conducted in 2020, received responses from 15,278 congregations representing at least 80 denominations across four faith traditions. One of their specialized reports based on 2020 research is FACTs on Finance: Trends in Congregational Economics from the Faith Communities Today 2020 Study by Sean Payne, David P. King, and Susan Barnett. They report personnel spending average proportions for three denominational traditions. FACT includes Black Protestant churches within either the mainline or evangelical group for these figures.
| Survey | Year | Evangelical Protestant | Mainline Protestant | Roman Catholic |
| Faith Communities Today | 2020 | 44% | 47% | 43% |
Another recent and comprehensive study of congregational finances is The National Study of Congregations’ Economic Practices (NSCEP). Conducted by the Lake Institute on Faith and Giving at the Indiana University Lilly Family School of Philanthropy, their report was issued in 2018. David P. King and Brad R. Fulton were co-directors of what the Institute describes as the largest and most comprehensive nationally representative study of U.S. congregations’ finances in more than a generation. This study found these average percentages of congregational budgets spent on all personnel costs among four traditions of denominations.
| Survey | Year | Black Protestant | Evangelical Protestant | Mainline Protestant | Roman Catholic |
| Lake Institute on Faith and Giving | 2020 | 24% | 49% | 55% | 43% |
Comparisons by denominations
Many denominations receive annual reports from their churches detailing a host of statistical indicators. They usually include financial results from the previous year. One would think that where such annual denominational data are available, the financial trends across these denominational churches could be compared. The difficulty comes in the spending components used on the prescribed reporting templates. For our purposes, the drawback is that personnel spending is often bundled with other expenses for annual reporting. In the few cases in which personnel expenses are isolated, we can make our best analysis of trends and comparisons across traditions. Below are the 2019 percentages from three denominations.
| Denominational Data Reports | Year | Personnel Spending |
| Church of the Nazarene | 2019 | 41% |
| Episcopal Church | 2019 | 50% |
| United Methodist Church | 2019 | 46% |
Comparisons by church size
We have also examined personnel spending percentages among congregations of different sizes. While the overall religious traditions and denominations may show certain trends, it is possible that groups of churches within those traditions may experience divergent trends based on their size. It could be that the size of your congregation may shape your spending percentages more than your denominational tradition.
The Lake Institute research found the percentages reported in this table among various size groupings of congregations based on the number of adult participants.
| Church sizes | Personnel percentage of expenditures |
| 1,000 or more adults | 46% |
| 250-999 adults | 53% |
| 100-249 adults | 54% |
| 50-99 adults | 52% |
| 10-49 adults | 50% |
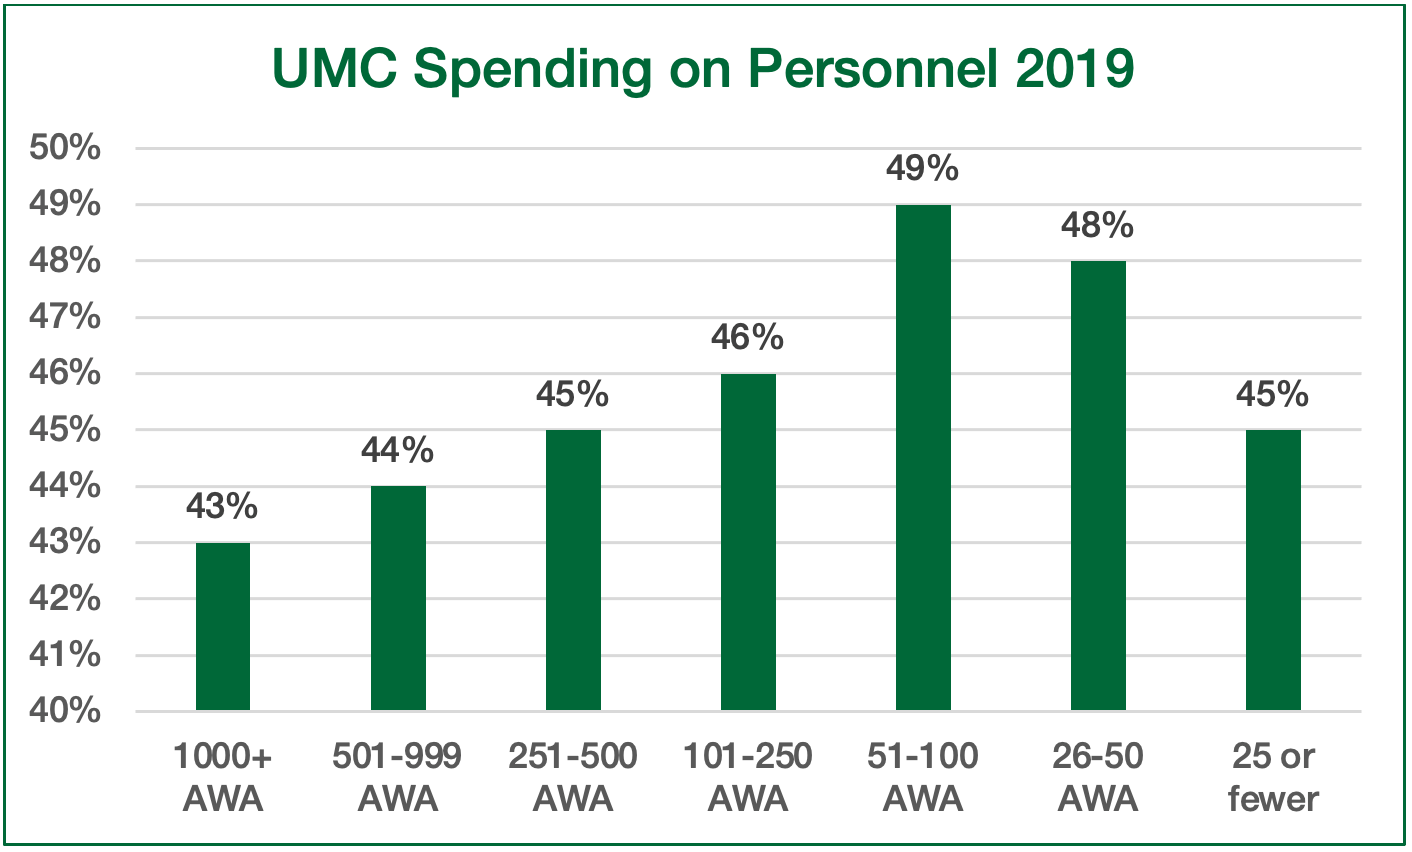
The United Methodist Church (UMC) reports personnel spending in categories that permit detailed comparisons across size tiers of churches. The table and chart are based on the average worship attendance (AWA) of the congregations.
| UMC Size Tiers – 2019 | Personnel percentage of expenditures |
| 1,000+ AWA | 43% |
| 501-999 AWA | 44% |
| 251-500 AWA | 45% |
| 101-250 AWA | 46% |
| 51-100 AWA | 49% |
| 26-50 AWA | 48% |
| 25 or fewer AWA | 45% |

Since these figures represent proportionate spending, the factors are both how much is spent on personnel and the total resources available for all spending. It appears that the largest churches (501 or more attendance), while spending more in actual dollars than smaller congregations, have enough total resources that those personnel expenses take a smaller percentage of their budgets. The highest percentage of budgets spent on personnel in 2019 was among churches with 51-100 or 26-50 in worship attendance. Among the very smallest of congregations, those with 25 or fewer in attendance (10,586 churches of this size in 2019), the percentage spent for personnel declines. It could be that in these cases, the fixed costs of facilities mean they have less to spend on personnel, which consists usually of a part-time or shared pastor or lay supply.
What might this mean for your congregation?
Churches are different, and spending patterns reflect a confluence of factors that represent various combinations of policies, tradition, makeup of personnel, and recent financial realities. The question does not need to be, “Is our percentage right?” but, “What can we learn from these comparisons?” Whatever your current percentages are, any changes normally must come over time based on decisions sequenced in thoughtful and missional ways.
For all churches, it may be helpful to step back and ask even more basic questions, such as, “What are the roles and tasks for which the church’s mission requires paid personnel?” A church must always decide how it will fulfill its mission to the greatest extent possible with available resources. Since personnel decisions are made on a case-by-case basis given circumstances and needs at a particular time, it is not uncommon for churches to develop staffing configurations that may or may not fit a church’s mission, current needs, or financial realities. Careful discernment by the congregation and its leaders may result in the recognition that changes in personnel are needed. Such decisions and their implementation always must be planned thoughtfully so as not to disrupt the mission or people involved.
Related Resources
- Is It Time to Right-Size Your Staff? by Jim Kitchens
- Staffing When You Can’t Afford to Staff by Dan Hotchkiss
- 6 Ways to Know f Your Church is Overstaffed by Ann A. Michel


