Church finance expert Bonnie Ives Marden says presenting your budget in narrative form provides a powerful tool for stewardship, evangelism, and marketing. She outlines a step-by-step process for converting a standard line item budget to an inspiring document that highlights your mission.
To celebrate the Lewis Center’s anniversary, we are highlighting Leading Articles — some of our most popular posts of the past 20 years. We are pleased to share again this article by Bonnie Ives Marden, originally published on August 14, 2019.
A picture is worth a thousand words! A narrative budget presentation that converts your line item budget into an inspiring visual is useful during a pledge or commitment campaign, for ongoing stewardship education, or as part of a visitor information packet.
Transforming your line item budget into a mission-oriented story requires a moderately simple math exercise, most easily managed using a spreadsheet program, such as Excel. Work with a small team of leaders, including Finance and Stewardship Committee members, staff, a skilled writer, and a graphic artist, if available, to supplement your budget story or pie chart with pictures of people and ministries as well as testimonials. Most importantly, have fun and celebrate all God is doing through your mission.
Step 1. Select four to six categories that encompass your ministry activities.
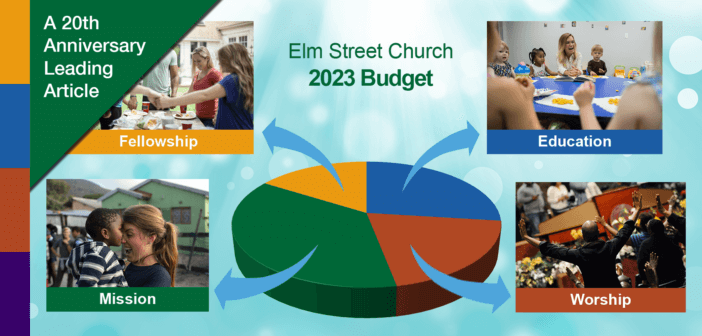
In most settings, worship, education, mission, fellowship, and pastoral care will work. Select categories that fit your ministry context. Do not create categories for administration, facilities, debt, or staff; these are distributed over the broader categories. This document promotes your mission; it is not intended to replace the accounting tools used by committees. Too many categories will diminish the impact of your chart results. Remember your audience is your community, not committee members.
Step 2. Assign percentage of each budget line item to each category.
Using a spreadsheet version of the current or recent line item budget, create one column for each category. Then, assign percentages representing the approximate amount of each line item for each category. Administration and infrastructure costs (e.g., utilities, staff, debt) are distributed across the categories. Some items will clearly belong in one column, while others will fit into a number of categories. For example, the choir director may fall 100 percent in the worship category. Or that job might also include team building and even congregational care, so worship might receive 90 percent, and fellowship and congregational care five percent each. While a time analysis would generate much more detailed results, usually a rough estimate will suffice.
Step 3. Calculate the dollar amount of each line item assigned to each category.
For each line item in the budget, show the dollars spent by category according to your estimated percentages. For example, $14,000 budgeted for the organist can be allocated to worship (100%), but $2,000 budgeted for community meals could be allocated as $1,000 for fellowship and $1,000 for mission.
Step 4. Calculate the percent of the total budget allocated to each category.
Next, for each category, combine the amount allocated to that category within each line item to get the category total. Divide the category total by the budget total to get the part of the total budget supporting that category.
Step 5. Create a pie chart.
Create a chart to show categories visually (Excel offers a simple mechanism for this). A pie chart is an effective visual. It offers category narratives in an attractive and inviting format. Samples are available online. A pie chart labeled with percentages, dollar amounts, or both, can orient people to your missional priorities. After perfecting labels and colors, the pie chart can be pasted into another document.
Step 6. Write ministry category descriptions.
Be sure to include activities, special events, and programs. This provides inspiring and helpful information to readers. Illustrate with inspirational stories to show how your mission and ministry impact and change lives. Use pictures and video of your church members and donors to show ministry in action. Then invite others into the vision by identifying several exciting emerging missions. Plant ideas and sow the seeds of what will be possible as resources increase.
Step 7. Design and share an attractive presentation of your narrative budget.
A good design eye is helpful, and many formats — one page, booklet, three columns, bulletin insert, slide presentations (such as PowerPoint) — are available and effective. Promote generosity by celebrating your mission activities! Watch the energy grow.
This material is excerpted from Church Finances for Missional Leaders: Best Practices for Faithful Stewardship (2019 by the General Board of Higher Education and Ministry) by Bonnie Ives Marden. Used by permission. The book is available at Cokesbury.
 Related Resources
- Developing Your Operating Budget, a Lewis Center video tool kit resource
- The Importance of a Narrative Budget by Dave Ponting
- Models for Budget Building by Lovett H. Weems, Jr


